Artemis Announces Feasibility Study for Blackwater Project
- INDUSTRY LEADING AFTER-TAX NPV5% OF C$2.15 BILLION
- COMPELLING AFTER-TAX BASE CASE IRR OF 32% FOR A WORLD CLASS, LARGE SCALE, ADVANCED DEVELOPMENT ASSET IN A TIER-ONE MINING JURISDICTION
- LEVERED AFTER-TAX IRR OF 43%
- YEARS 1-5: AVERAGE ANNUAL GOLD PRODUCTION UP 29% FROM THE 2020 PFS TO 321,000 OUNCES AT AISC OF US$578/oz, AVERAGE GRADE OF 1.62 g/t Au AND STRIP RATIO OF 1.7:1
- YEARS 1-10: AVERAGE ANNUAL GOLD PRODUCTION OF 351,000 OUNCES AT AISC OF US$643/oz
- LOM: AVERAGE ANNUAL GOLD PRODUCTION OF 339,000 OUNCES AT AISC OF US$672/oz
- AFTER-TAX PAYBACK PERIOD OF 2 YEARS
- DE-RISKS CAPEX AND OPEX ESTIMATES & UPDATES FOR CURRENT PRICES
- A 9% INCREASE IN INITIAL DEVELOPMENT CAPITAL TO C$645 MILLION ACHIEVES A 9% INCREASE IN INITIAL ANNUAL THROUGHPUT, COSTING UPDATED REFLECTS LARGER CRUSHING CIRCUIT AND INVESTMENTS IN ESG
(Vancouver, September 13, 2021) Artemis Gold Inc. (“Artemis” or the “Company”) is pleased to announce the results of its 2021 Feasibility Study (“FS” or the “Study”) for the staged development of the 100% owned Blackwater Gold Project in central British Columbia (“Blackwater” or the “Project”).
The results of the Study supersede the 2020 Prefeasibility Study (“2020 PFS”) dated August 26, 2020 entitled “Blackwater Gold Project British Columbia NI 43-101 Technical Report on Pre-Feasibility Study” filed on SEDAR by Artemis on September 18, 2020. The results of the FS reflect several positive changes in the approach to the planned development of the Blackwater Project compared with the 2020 PFS. The scope changes incorporated in the Study include:
- Higher initial throughput: Phase 1 throughput has been expanded 9% to 6 million tonnes per annum (“Mtpa”) with a larger crushing circuit, providing greater operational throughput upside potential in the early years, up from 5.5Mtpa in the 2020 PFS.
- Streamlined Phase 2 & 3 Expansions: a greatly reduced footprint of the FS Stage 1 facility, and the installation of a higher-capacity gyratory crusher in the proposed Stage 1 development. Importantly this allows for a streamlined and construction-ready approach to the Phase 2 Expansion throughput of 12Mtpa. The increase in up-front investment of C$53 million reduces expansion capital to:
- C$347 million (a reduction of C$79 million from C$426 million in the 2020 PFS) for the Phase 2 expansion to 12Mtpa
- C$374 million (a reduction of C$24 million from C$398 million in the 2020 PFS) for the Phase 3 expansion to 20Mtpa
- Net impact is a slight increase in total life of mine (“LOM”) capital to fund the 3 Phases of development to C$1,417 million, up from C$1,415 million in the 2020 PFS.
- Accelerated Phase 2 & Phase 3 expansions: Phase 2 expansion begins with an expansion to 9Mtpa in year 5 (up from 5.5Mtpa in year 5 in the 2020 PFS), ramping up to 12Mtpa in year 6. Phase 3 expansion begins with an expansion to 15Mtpa in year 10 (up from 12Mtpa in year 10 in the 2020 PFS), ramping up to 20Mtpa in year 11;
- An Environment, Social Governance (“ESG”) commitment in the Stage 1 development phase: an initial investment to replace diesel and propane-powered components within the process plant facility reduces the carbon footprint of the Project;
- Phase 3 throughput of 20Mtpa is supported by two mineral processing trains, reduced from three in the 2020 PFS: results in lower overall maintenance and labour costs, with improved economies of scale at higher throughput rates;
- Estimate accuracy increased with reduced risk: the FS costing accuracy has improved to +15% /-10% (from +25%/-10% in the 2020 PFS). Engineering undertaken in connection with the guaranteed maximum price (“GMP”) memorandum of understanding (“MOU”) on each of the process plant and the power transmission line have de-risked these components since the 2020 PFS. The achievement of negotiated fixed-price EPC contracts for these components of capital cost (targeted for Q4 2021/Q1 2022) will also mitigate the potential for capital cost and schedule overruns on up to approximately 50% of the initial development capital estimate;
- Compelling economics even after reflecting current inflationary pressures, timelines and additional management driven environmental investments: the initial development capital has increased 9% to C$645 million, up from C$592 million, which provides a 9% increase in Phase 1 annual throughput, with current pricing, and environmental investments. The net result is an after-tax net present value at a 5% discount rate (“NPV5%“) of C$2.15 billion, an after-tax Internal rate of return (“IRR”) of 32%, and an after-tax payback period of 2.3 years, essentially in line with the 2020 PFS.
Key Economic Outputs of the Study
- Base case after-tax NPV5% of C$2.15 billion reflecting current market consensus long term forecast gold price of US$1,600/oz and 0.79 USD/CAD exchange rate (C$2,025/oz, effectively the same C$ gold price as the 2020 PFS of C$2,028/oz) increasing to C$2.76 billion at a US$1,800/oz gold price;
- Base case after-tax IRR of 32%, approximating the 2020 PFS after-tax IRR of 35% after incorporating higher initial development capital and ESG investments. Levered1 after-tax IRR of 43%;
- Initial development capital cost of C$645 million to develop a 6Mtpa Phase 1 open pit mining and processing operation (up from a 5.5Mtpa operation in the 2020 PFS);
- Exceptional after-tax payback period on initial capital cost of 2.3 years;
- Optimized mine plan increases average grade to 1.62 g/t Au over the first five years of production, up from 1.57 g/t Au in the 2020 PFS, combined with average throughput of 6.6Mtpa increases average annual gold production by 29% (compared with the 2020 PFS) to 321,000 ounces of gold at an all-in sustaining cash cost (“AISC2”) of C$732/oz generating annual free cash flow (“FCF”) of C$301 million.
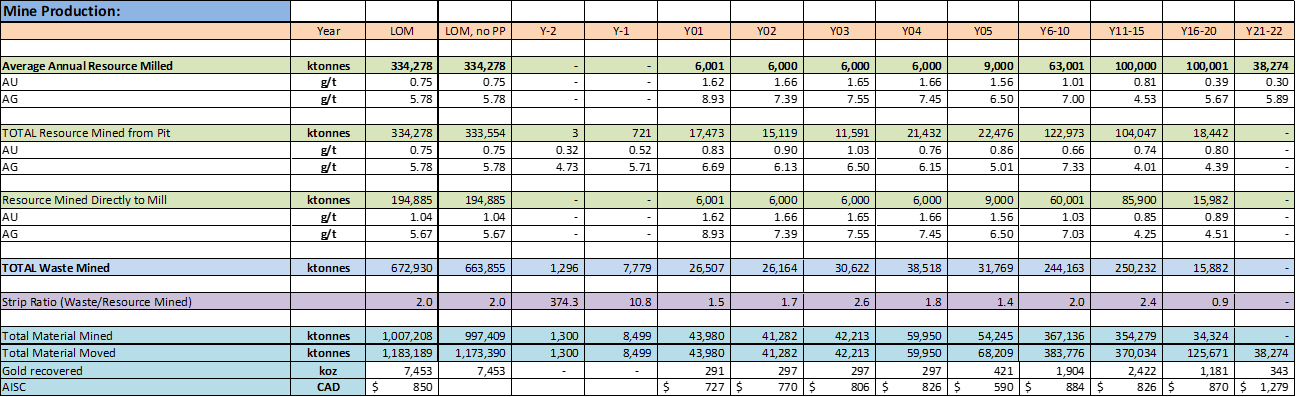
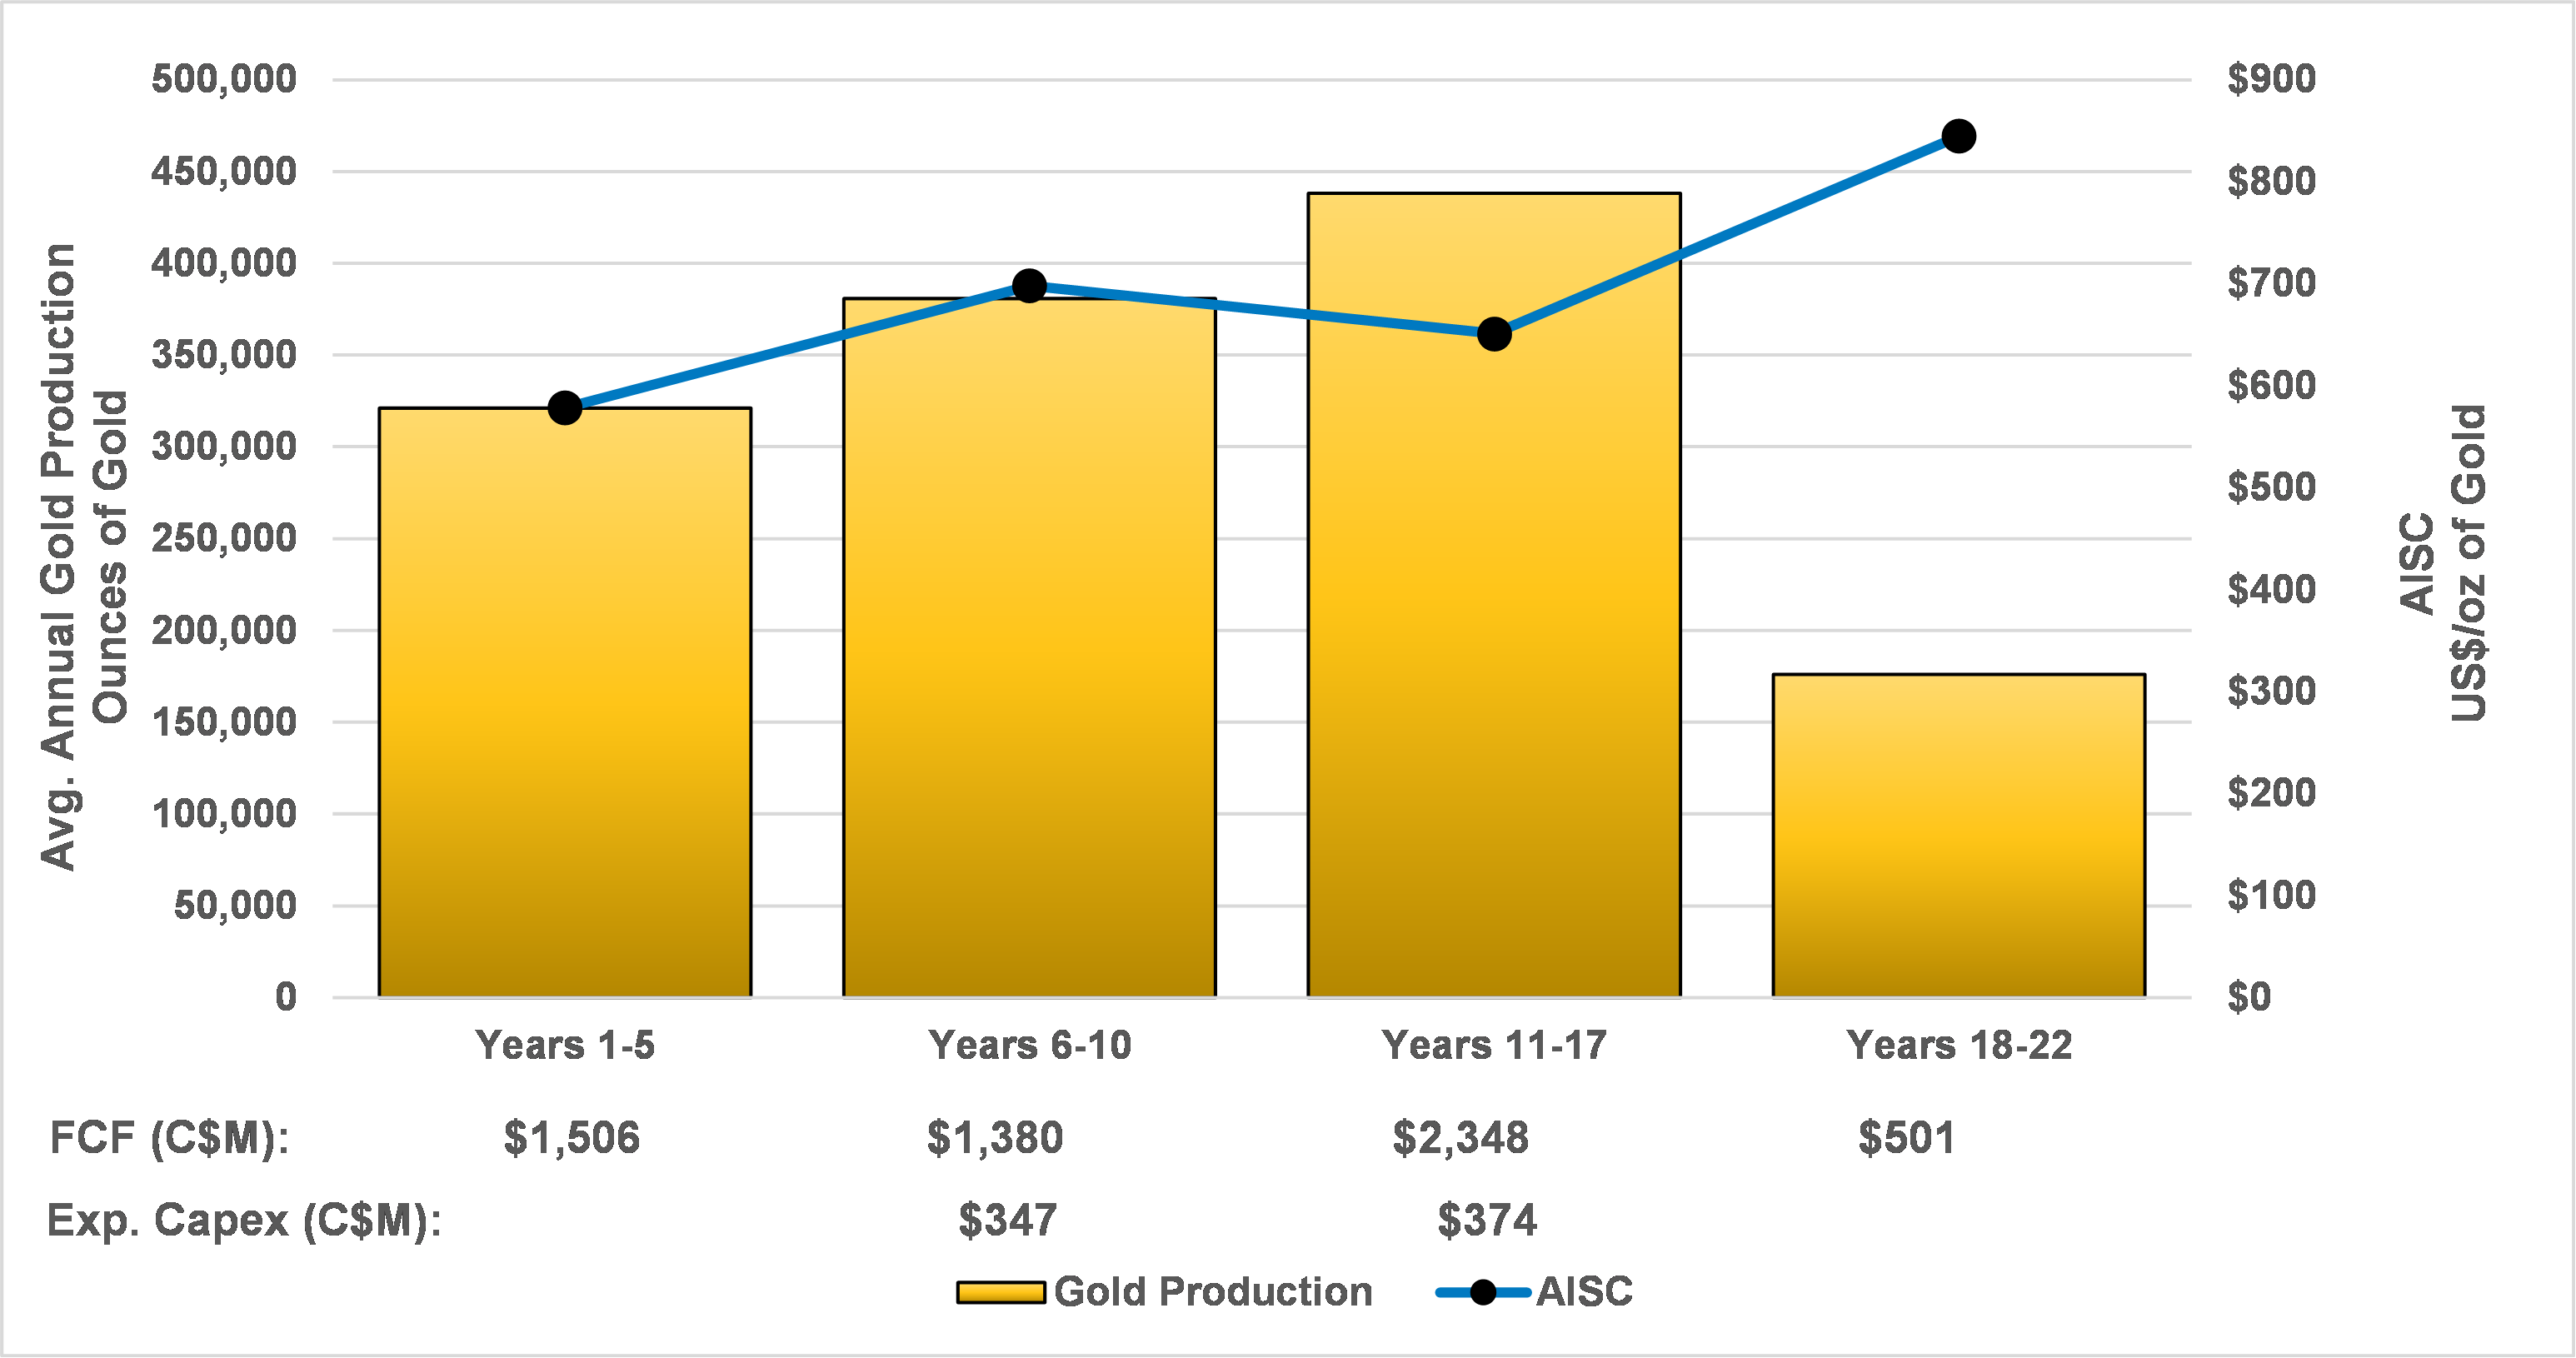
Annual Gold production and AISC over the LOM is presented in Table 1.
Table 1: Average Annual Gold Production, AISC and FCF For the Blackwater Gold Project
| Period | Average Annual Gold Production | AISC2 | Average Annual FCF3 |
| Years 1-5 | 321,000 | C$732 | C$301m |
| Years 1-10 | 351,000 | C$814 | C$289m |
| Years 11-17 | 438,000 | C$824 | C$335m |
| Years 18-22 | 176,000 | C$1,069 | C$100m |
| LOM | 339,000 | C$850 | C$240m |
A summary of the technical and financial metrics of the Study in comparison with the 2020 PFS is provided in the Table 2.
Table 2 – Key Results of the FS (including the New Gold Inc. Stream, defined below)
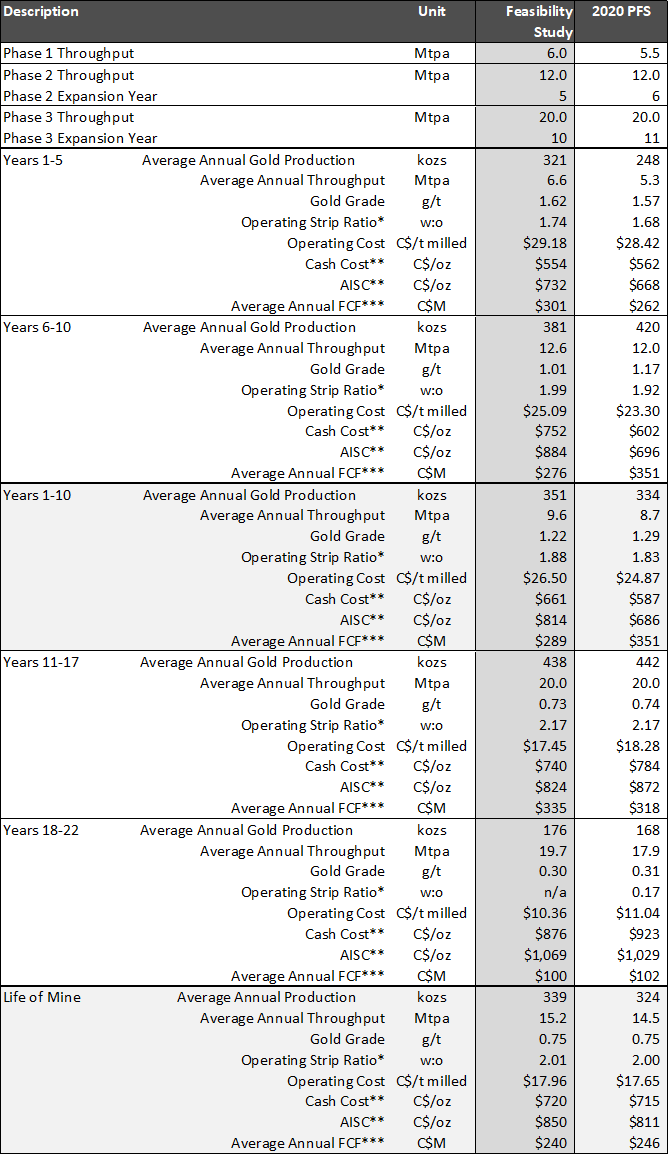
*Operational strip ratio is calculated as total waste mined divided by ore mined
**Please refer to non-IFRS measures notice at the end of this news release for definition of AISC.
***Free cash flow is calculated as project operating cash flow minus sustaining/closure capital and taxes
~Levered case assumptions and parameters are disclosed below under “Economic Results”. The Leveraged Case reflects the impact of debt. Financing of the Project is not a measure of the economic viability and technical feasibility of the Project, but a measure of the Company’s ability to secure debt financing for the Project.
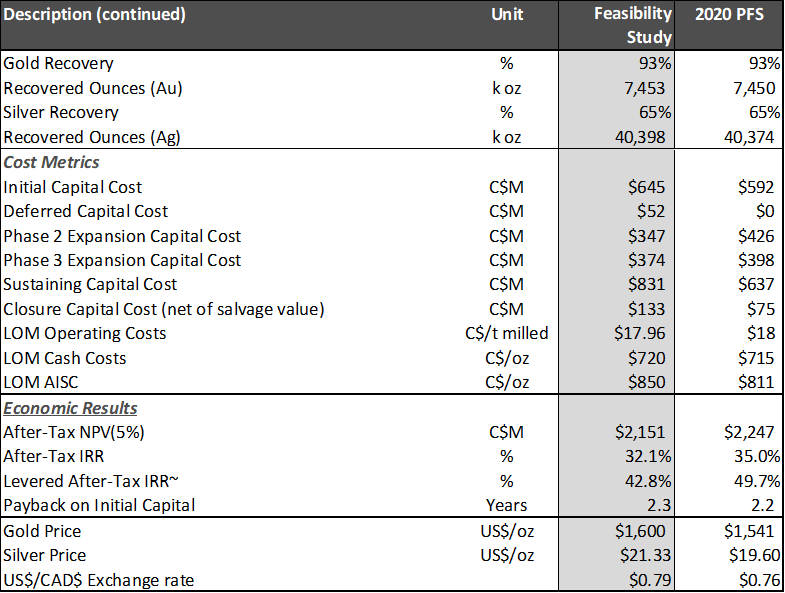
The estimate of life of mine sustaining capital in the FS has increased by C$194 million to C$831 million compared with the C$637 million estimate of sustaining capital in the 2020 PFS. The increase in sustaining capital is a reflection of more accurate cost estimates related predominantly to the continuous expansion of the tailings storage facility (“TSF”) and water management systems as well as the cost of the replacement mining fleet over the LOM. The increase in sustaining capital over the life of mine is the larger factor that contributed to an increase in the AISC to C$850/oz in the FS, up from C$811/oz in the 2020 PFS.
The base case economics are calculated on an unlevered basis, based on a market consensus long term gold price of US$1,600/oz, a silver price of US$21.33/oz and a foreign exchange rate of CAD$1 = USD$0.79. The economics include the effect of the Blackwater gold stream (the “Stream”), which was issued to finance part of the acquisition cost of Blackwater by Artemis from New Gold Inc. (“New Gold”) (refer to news release dated August 24, 2020). Under the terms of the Stream, New Gold will purchase 8.0% of the refined gold produced from the Project. Once 279,908 ounces of refined gold have been delivered to New Gold, the gold stream will reduce to 4.0%. New Gold will make payments for the gold purchased equal to 35% of the US dollar gold price quoted by the London Bullion Market Association two days prior to delivery.
The figures and tables below show the sensitivity of after-tax NPV and IRR to changes in the US dollar gold price and the CAD/USD exchange rate.
Figure 1 – Sensitivity of Base Case After-Tax NPV5% (C$ Billions) to Changes in US$ Gold Price Holding the USD/CAD Exchange Rate Fixed at 0.79 (base case highlighted)
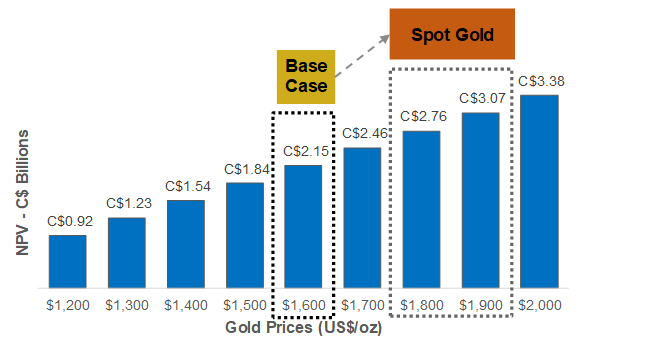
Table 3 – Sensitivity on Base Case After-Tax NPV5% (C$ Millions) to Changes in US$ Gold Price and USD/CAD Exchange Rate (base case highlighted)
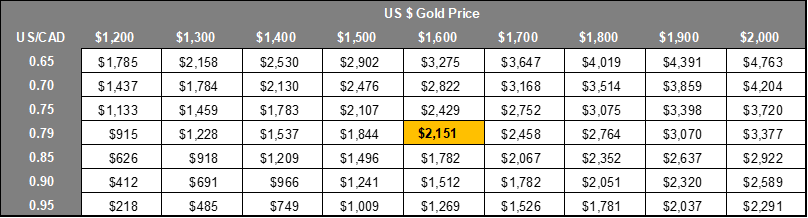
Figure 2 – Sensitivity of Base Case After-Tax IRR to Changes in US$ Gold Price Holding the USD/CAD Exchange Rate Fixed at 0.79 (base case highlighted)
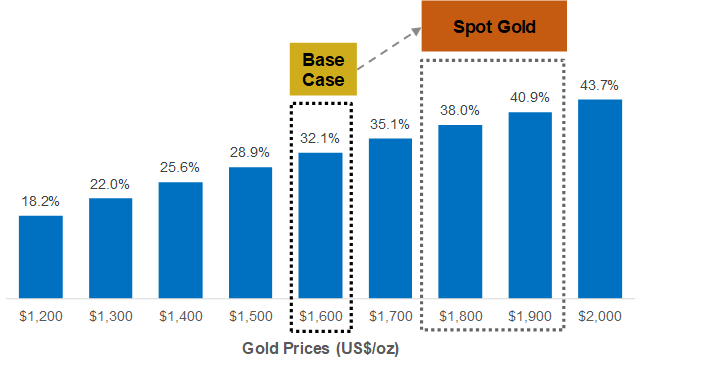
Table 4 – Sensitivity on Base Case After-Tax IRR to Changes in US$ Gold Price and USD/CAD Exchange Rate (base case highlighted)
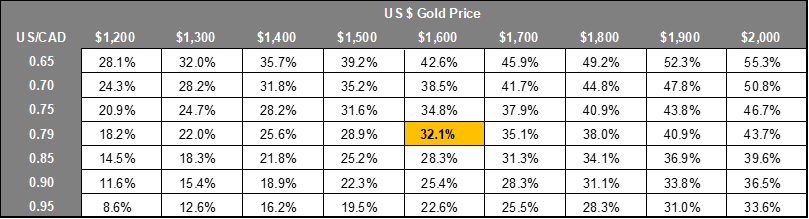
Figure 3 – Blackwater Gold Production and AISC Profile
Steven Dean, Chairman and CEO of Artemis commented: “Since the release of the 2020 PFS, Artemis has been focused on optimizing and de-risking the Blackwater project, which has culminated in the compelling economics outlined in the FS. Expanded Phase 1 throughput and an acceleration of the Phase 2 expansion supports a 29% increase in gold production over the first five years of operations and a 5% increase in gold production over the first 10 years. By installing a larger capacity crushing circuit with a primary gyratory crusher up front, the Phase 2 expansion has been streamlined with the addition of major items such as an upgradable conveyor, an additional ball mill and additional tanks, which supports the ultimate expansion to 20Mtpa in two mineral processing trains, down from three in the 2020 PFS, improving economies of scale. The FS has a more constrained cost estimate accuracy, better mitigates Project risk, reflects current costs, and reflects an investment in electrification of the process plant in phase 1 to reduce the Project’s carbon footprint.”
“After applying this approach to the development of the Blackwater Project, the initial development capital has increased to C$645 million, a 9% increase in line with the 9% increase in the initial throughput rate. The FS base case economics demonstrate a payback period of two years, an after-tax IRR of 32% and an NPV5% of C$2.15 billion based on a US$1,600/oz gold price, increasing to C$2.8 billion at a US$1,800/oz gold price. We look forward to continuing to work with our partners, including the Lhoosk’uz Dené Nation, Ulkatcho First Nation, the Carrier Sekani First Nations and Nazko First Nation and with the support of the BC and Federal Governments, to further advance the Blackwater Project. With the FS now completed, Blackwater continues to target a start of construction in Q2 2022, which puts the Project on track to develop into a new tier 1 gold operation in Q1 2024.”
The Study
The Study was led by Ausenco Engineering Canada Inc. (“Ausenco”), together with the support of Knight Piésold Ltd. (“KP”), Moose Mountain Technical Services (“MMTS”), Allnorth Consultants Ltd. (“Allnorth”), Lorax Environmental Services Ltd. (“Lorax”), ERM Consultants Canada Ltd. (“ERM”) and JAT MetConsult Ltd., all of which are independent of the Company.
The Company presented two cases as part of the FS: a base case which is unlevered, and an alternate levered case which assumes C$360 million (plus up to C$25 million of capitalized interest) is funded through project debt.
The Company set out to meet or exceed the economics of the Blackwater Project and improve the accuracy and financeability of the Project against the 2020 PFS. Artemis’ methodology and approach to development of the Project includes the following:
- Phase 1: increasing throughput to 6.0Mtpa, up from 5.5Mtpa in the 2020 PFS, increasing gold production while maintaining an average grade of 1.62 g/t Au over the first five years of operations;
- Phase 2: acceleration of the Phase 2 expansion to 12Mtpa ramping up to 9Mtpa in year five with full Phase 2 throughput expansion achieved in year six;
- Increased production Years 1-5: the higher initial throughput and accelerated expansion supports a 29% increase in average annual gold production over the first five years of operation to 321,000 ounces;
- Phase 3: acceleration of the Phase 3 expansion to 20Mtpa ramping up to 15Mtpa in year 10 with full Phase 3 expansion achieved in year 11;
- Increased production Years 1-10: higher throughput and accelerated expansion results in a 5% increase in the average annual gold production to 351,000 ounces of gold over the first 10 years of operations;
- Phase 4: Mining operations are assumed to cease in year 17 with stockpiled ore rehandled and processed through the process plant in years 18-22. The decrease in mine life to 22 years from 23 years in the 2020 PFS is a direct result of the increased throughput rate and production during the first 10 years of the mine life in the FS; Table 5 outlines the throughput rates by phase;
Table 5 – Throughput Levels by Phase (See Appendix A for Detailed Mine Schedule)
| Phase | Years | Annual Throughput (Mt) |
| 1 | 1-4 | 6 |
| 5 | 9 | |
| 2 | 6-9 | 12 |
| 10 | 15 | |
| 3 | 11-17 | 20 |
| 4 | 18-22 | 20 |
- Higher capacity up front crushing circuit optimizes Stage 2 expansion constructability: the crushing circuit was re-designed to incorporate a primary gyratory crusher within the three-stage crushing circuit, provides greater operational throughput upside potential in the early years, which allows for an optimized expansion case for Phase 2 throughput of 12Mtpa.
- Infrastructure: reduced overall process footprint and laydown area requirements, resulting in a net reduction in the length of the conveyor belts and reduced mine haulage distances;
- Electrification of process plant: the 2020 PFS included diesel and propane-fueled process plant components, which have been converted to electrical components as an ESG investment to reduce the carbon footprint of the process plant.
Mineral Resource Estimate
The Mineral Resource Estimate for the Blackwater Project is effectively unchanged from the estimate incorporated into the 2020 PFS. The Mineral Resource is estimated from a drill hole database containing 1,002 drill holes and 288,738 assay intervals. Three domains were generated based on the major north-south fault and changes in orientation of the mineralization. The block model has a 10 x 10 x 10 m selective mining unit, with interpolation of gold done by multiple indicator kriging (“MIK”) and interpolation of silver using ordinary kriging (“OK”). The interpolations were limited by domain boundaries and were clipped to the overburden surface. Blocks were assigned a preliminary classification based on variography and drill hole spacing by domain, with Measured and Indicated confidence classifications then adjusted for block continuity.
The base case cut-off grade, within the "reasonable prospects of eventual economic extraction” pit shell is 0.20 g/t gold equivalent (“AuEq”), where the AuEq is calculated as AuEq = Au g/t + (Ag g/t x 0.006). At the base case prices, exchange rate and smelter terms a 0.20g/t AuEq cut-off covers the processing costs of C$9.00/t processed. At a 0.20 g/t AuEq cut-off, the total Measured and Indicated Mineral Resource is estimated at 597 Mt at 0.65 g/t AuEq, 0.61 g/t Au, and 6.4 g/t Ag for a total of 12.4 million AuEq ounces. Of the total Measured and Indicated Mineral Resources, 75% are in the Measured category. Table 6 summarizes the Mineral Resource estimate and includes sensitivity cases to show the estimate sensitivity to changes in cut-off grade.
Table 6 – Mineral Resource Table Showing Sensitivity to Cut-off Grades (base case highlighted)
| Grades | Metal | |||||||
| Classification | Cutoff | Tonnage | AuEq | Au | Ag | AuEq | Au | Ag |
| (AuEq g/t) | (ktonnes) | (g/t) | (g/t) | (g/t) | (koz) | (koz) | (koz) | |
| Measured | 0.20 | 427,123 | 0.68 | 0.65 | 5.5 | 9,360 | 8,905 | 75,802 |
| 0.30 | 313,739 | 0.84 | 0.80 | 5.9 | 8,463 | 8,109 | 59,009 | |
| 0.40 | 238,649 | 0.99 | 0.96 | 6.1 | 7,627 | 7,347 | 46,727 | |
| 0.50 | 186,687 | 1.15 | 1.11 | 6.2 | 6,881 | 6,656 | 37,333 | |
| 0.60 | 149,261 | 1.30 | 1.26 | 6.4 | 6,223 | 6,039 | 30,521 | |
| 0.70 | 120,916 | 1.45 | 1.41 | 6.6 | 5,633 | 5,479 | 25,619 | |
| Indicated | 0.20 | 169,642 | 0.56 | 0.51 | 8.5 | 3,046 | 2,766 | 46,578 |
| 0.30 | 123,309 | 0.68 | 0.61 | 10.4 | 2,677 | 2,431 | 41,112 | |
| 0.40 | 86,473 | 0.81 | 0.74 | 12.4 | 2,264 | 2,057 | 34,419 | |
| 0.50 | 64,305 | 0.94 | 0.85 | 14.8 | 1,947 | 1,763 | 30,681 | |
| 0.60 | 50,527 | 1.05 | 0.95 | 17.2 | 1,705 | 1,537 | 27,957 | |
| 0.70 | 40,317 | 1.15 | 1.03 | 19.6 | 1,493 | 1,340 | 25,458 | |
| Measured + Indicated | 0.20 | 596,765 | 0.65 | 0.61 | 6.4 | 12,406 | 11,672 | 122,381 |
| 0.30 | 437,048 | 0.79 | 0.75 | 7.1 | 11,140 | 10,540 | 100,120 | |
| 0.40 | 325,122 | 0.95 | 0.90 | 7.8 | 9,890 | 9,404 | 81,146 | |
| 0.50 | 250,992 | 1.09 | 1.04 | 8.4 | 8,828 | 8,419 | 68,014 | |
| 0.60 | 199,788 | 1.23 | 1.18 | 9.1 | 7,928 | 7,577 | 58,478 | |
| 0.70 | 161,233 | 1.37 | 1.32 | 9.9 | 7,125 | 6,819 | 51,077 | |
| Inferred | 0.20 | 16,935 | 0.53 | 0.45 | 12.8 | 288 | 246 | 6,953 |
| 0.30 | 11,485 | 0.66 | 0.57 | 16.2 | 245 | 210 | 5,971 | |
| 0.40 | 8,690 | 0.77 | 0.65 | 19.2 | 214 | 182 | 5,373 | |
| 0.50 | 5,552 | 0.95 | 0.79 | 26.0 | 169 | 142 | 4,648 | |
| 0.60 | 4,065 | 1.10 | 0.90 | 32.7 | 143 | 118 | 4,279 | |
| 0.70 | 3,328 | 1.20 | 0.97 | 36.9 | 128 | 104 | 3,951 | |
- The Mineral Resource estimate was prepared by Sue Bird, P.Eng., the Qualified Person for the estimate and an employee of MMTS. The estimate has an effective date of May 5, 2020.
- Mineral Resources are reported using the 2014 CIM Definition Standards and are estimated in accordance with the 2019 CIM Best Practices Guidelines.
- Mineral Resources are reported inclusive of Mineral Reserves.
- Mineral Resources that are not Mineral Reserves do not have demonstrated economic viability.
- The Mineral Resource has been confined by a conceptual pit shell to meet “reasonable prospects of eventual economic extraction” using the following assumptions: the 143% price case with a base case of US$1,400/oz. Au and US$15/oz Ag at a currency exchange rate of 0.75 US$ per C$; 99.9% payable Au; 95.0% payable Ag; US$8.50/oz Au and US$0.25/oz Ag offsite costs (refining, transport and insurance); a 1.5% NSR royalty; and uses a 93% metallurgical recovery for gold and 55% recovery for silver.
- The AuEq values were calculated using US$1,400/oz Au, US$15/oz Ag, a gold metallurgical recovery of 93%, silver metallurgical recovery of 55%, and mining smelter terms for the following equation: AuEq = Au g/t + (Ag g/t x 0.006).
- The specific gravity of the deposit has been determined by lithology as being between 2.6 and 2.74.
- Numbers may not add due to rounding.
There are no other known factors or issues that materially affect the Mineral Resource estimate other than normal risks faced by mining projects in the province in terms of environmental, permitting, taxation, socio-economic, marketing, and political factors. Additional risk factors are listed in the “Cautionary Note Regarding Forward-Looking Information” section at the end of this news release.
Mineral Reserve Estimate
The Mineral Reserve Estimate for the Blackwater Project is effectively unchanged from the estimate incorporated into the 2020 PFS. The Mineral Reserves for Blackwater are a subset of the Measured and Indicated Mineral Resources, described above. Proven and Probable Mineral Reserves are modified from Measured and Indicated Mineral Resources and are summarized in Table 7. Inferred Mineral Resources are set to waste.
Table 7 – Mineral Reserve Estimate
| Classification | Run of Mine
(Mt) |
AuEq Grade
(g/t) |
Gold Grade
(Au, g/t) |
Contained Metal
(Au, Moz.) |
Silver Grade
(Ag, g/t) |
Contained Metal
(Ag, Moz.) |
| Proven | 325.1 | 0.78 | 0.74 | 7.8 | 5.8 | 60.4 |
| Probable | 9.2 | 0.83 | 0.80 | 0.2 | 5.8 | 1.7 |
| Total Reserve | 334.3 | 0.78 | 0.75 | 8.0 | 5.8 | 62.2 |
Notes:
- The Mineral Reserve estimates were prepared by Marc Schulte, P.Eng., an MMTS employee, and have an effective date of September 10, 2021.
- Mineral Reserves are reported using the 2014 CIM Definition Standards and are estimated in accordance with the 2019 CIM Best Practices Guidelines
- Mineral Reserves are based on the FS LOM plan.
- Mineral Reserves are mined tonnes and grade; the reference point is the mill feed at the primary crusher and includes consideration for operational modifying factors such as loss and dilution.
- Mineral Reserves are reported at an NSR cut-off of C$13.00/t. The cut-off grade covers processing costs of C$9.00/t, general and administrative (“G&A”) costs of C$2.50/t and stockpile rehandle costs of C$1.50/t.
- Cut-off grade assumes US$1,400/oz. Au and US$15/oz Ag at a currency exchange rate of 0.75 US$ per C$; 99.9% payable gold; 95.0% payable silver; US$8.50/oz Au and US$0.25/oz Ag offsite costs (refining, transport and insurance); a 1.5% NSR royalty; and uses a 93% metallurgical recovery for gold and 55% recovery for silver.
- The AuEq values were calculated using commodity prices of US$1,400/oz Au, US$15/oz Ag, a gold metallurgical recovery of 93% silver metallurgical recovery of 55%, and mining smelter terms for the following equation: AuEq = Au g/t + (Ag g/t x 0.006).
- Numbers have been rounded as required by reporting guidelines.
Mineral Reserves are based on the Feasibility Study engineering and economic analysis for the Blackwater Project. Specific risk to the Mineral Reserves include changes to the following factors: Metal Prices, Foreign Exchange Rates, Interpretations of mineralization geometry and continuity of mineralization zones, geotechnical and hydrogeological assumptions, ability of the mining operation to meet the annual production rate, operating cost assumptions, mining and process plant recoveries, the ability to meet and maintain permitting and environmental license conditions and the ability to maintain the social licence to operate.
There are no other known factors or issues that materially affect the Mineral Reserve estimate other than which is disclosed above and normal risks faced by mining projects in the province in terms of environmental, permitting, taxation, socio-economic, marketing, and political factors and additional risk factors as listed in the “Cautionary Note Regarding Forward-Looking Information” section below.
Project Description
Location
The Project is located in central British Columbia, approximately 160 km southwest of Prince George and 446 km northeast of Vancouver. The Project is accessible by major highway and access/service roads.
Artemis has a 100% recorded interest in 329 mineral claims covering an area of 148,902 ha distributed among the Property and the Capoose, Auro, Key, Parlane and RJK claim blocks. Surface rights over the Project area are controlled by the Crown. A project location map is provided in Figure 4:
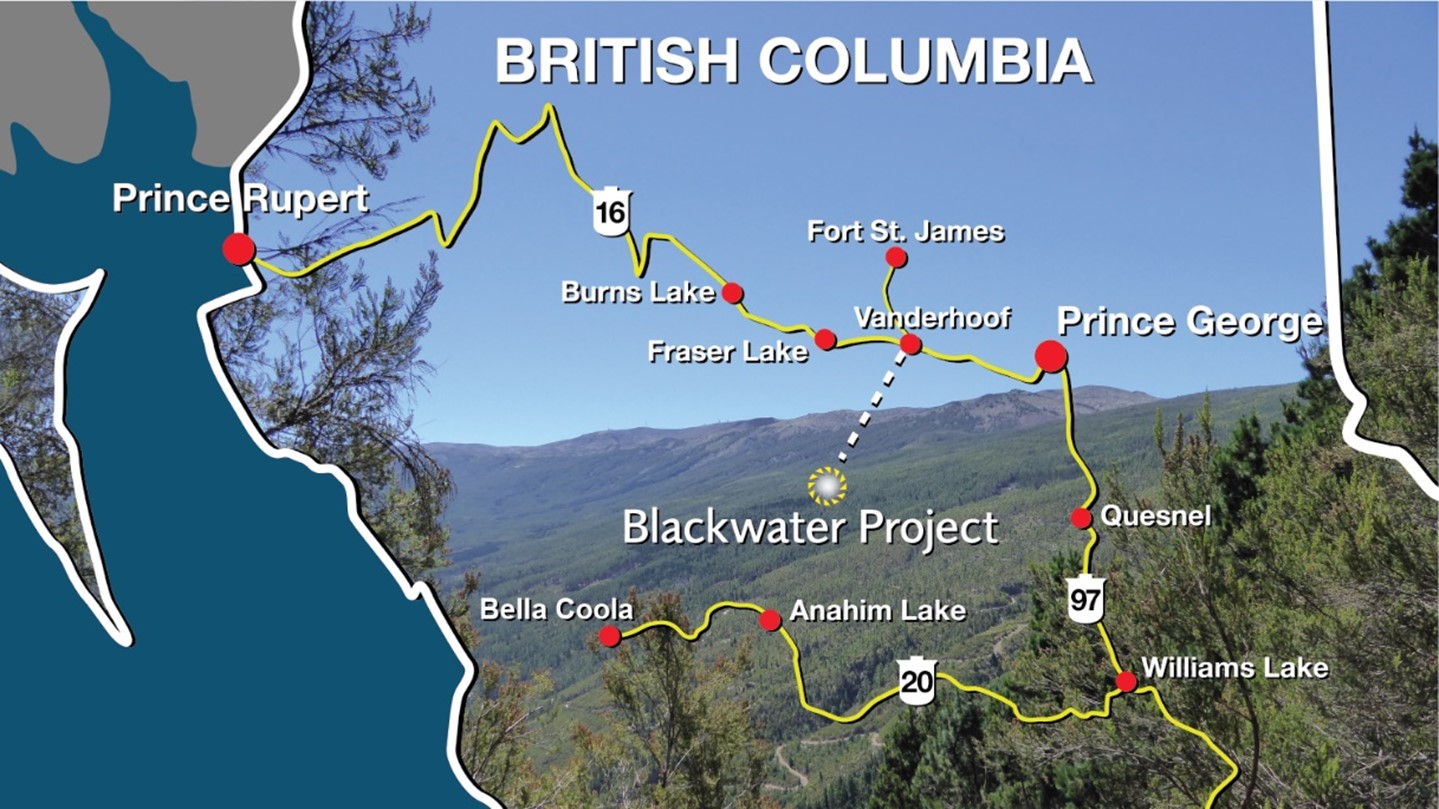
Figure 4 – Blackwater Project Location Map
Project Development Plan
The Blackwater Project will comprise the construction, operation, and closure of an open pit gold and silver mine and ore processing facilities commencing with a nominal milling rate of ~16,500 t/d (6.0Mtpa). The ore processing facilities will be expanded to ~24,700 tonnes per day (“tpd”) (9.0Mtpa) in year 5 with full Phase 2 expansion to ~33,000 tpd (12Mtpa) in year 6 with an expansion to 41,100 tpd (15Mtpa) in year 10 and a final expansion to achieve 55,000 t/d (20 Mtpa) starting in year 11 of operation. A combined gravity circuit and whole ore leach will be used for recovering gold and silver.
The proposed mine plan involves mining 334 Mt of ore, 586 Mt of waste rock and 87 Mt of overburden. Conventional open pit mining methods will be used, initially targeting high-grade, near-surface ore for processing, with lower-grade material being stockpiled for processing at the end of the mine life.
Most of the waste material sourced from the pit will be used for construction of TSF or placed in the TSF itself. Overburden and non potentially acid generating waste rock not required for construction will be placed in stockpiles between the open pit and the TSF. Potentially acid generating waste rock, together with tailings, will be deposited into the TSF that will be located to the north-northwest of the open pit.
In addition to the site infrastructure, it is assumed that a 135 km, 230 kV transmission line will be constructed from the BC Hydro Glenannan substation near Endako, B.C. to the site to supply power to the Project.
At closure, all buildings will be removed, disturbed lands rehabilitated, and the property returned to otherwise functional use according to future approved reclamation plans and accepted practices at the time of closure. The estimated closure costs of C$175 million (discounted to year 22) represents management’s investment in environmental stewardship and increased ownership of its various ESG initiatives.
Mining
Mining will be based on conventional open pit methods (drill-blast-load-haul), which are suited to the Project location and local site requirements. Open pit operations are anticipated to run for 17 years, excluding 15–18 months of pre-production mining. Following mining operations, stockpiled low-grade material will be processed for an additional five years, resulting in a total LOM of 22 years. The open pit will be developed with a series of pushbacks. The first stage will target suitable overburden and waste rock for construction whilst exposing near-surface, high-grade material. The second phase will target higher-grade, lower-strip-ratio ore providing mill feed over the initial years of the Project. The remaining stages expand the pit to the north targeting progressively deeper ore. LOM activities are summarized in Appendix A.
Owner-managed mining and fleet maintenance operations are planned for 365 days/year, with two 12-hour shifts planned per day. Initially, mining will be undertaken using 400 t class hydraulic shovels and 190 t payload class haul trucks. As production requirements increase, the load-and-haul fleet will be expanded with 600 t class hydraulic shovels and 230 t payload class haul trucks. The initial drill and loading fleet is planned to be diesel drive, with expansion fleet requirements being electric drive. The mine equipment fleet is planned to be purchased via various lease arrangements.
Metallurgy & Process
The process flowsheet was designed based on historical test work and more recent test work carried out in 2019 for New Gold. Some additional test work was completed to support carbon loading, rheological parameters and cyanide destruction assumptions.
The 2019 test program included three larger composites for optimization test work and 48 samples covering the deposit to establish the variability of the ore to the chosen flow sheet.
The mineralogy indicated that the sulphur content is mainly associated with pyrite, pyrrhotite and sphalerite. The comminution test work included semi-autogenous grind mill comminution on the new drill core, Bond rod mill work index, Bond ball mill work index and abrasion index tests. The results indicate the material is hard with results ranging from 11.8 -24.6 kWh/t and the 75th percentile of the samples tested was 21.1 kWh/t for the variability samples. A correlation between gold extraction and head grade was not observed. The variability composite results averaged 93.7% total gold extraction with gravity gold recovery of 34.2%.
Based on the test results, a gold doré can be produced with a primary grind size of 80% passing
150 μm followed by gravity concentration, two-hour pre-oxidation, a 24 hour cyanide leach at an initial cyanide concentration of 500 ppm and a pH of 10.5, and a carbon-in-leach (“CIL”) adsorption, desorption and refining process. The recovery of gold and silver is expected to be 93% and 65% respectively.
The initial design daily throughput is ~16,500 tonnes per day, with an availability of 70% used in designing the crushing circuit and 92% for the design of the rest of the plant.
Phase 1 Development:
The process for Phase 1 will consist of:
- Three-stage crushing, consisting of a primary gyratory crusher, a secondary cone crusher and two tertiary cone crushers, each of which will each be housed in steel-framed structures, with conveyors transporting material between each stage. Crushed product will be stored in a coarse ore conical stockpile;
- Crushed ore will be conveyed from the stockpile to a single, 7.3 m x 12.5 m, 14 MW ball mill for grinding, with the circuit being closed by cyclones. Gravity concentration will be incorporated into the grinding circuit using centrifugal concentrators and an intensive cyanide leach unit will be used for recovering gold from the gravity concentrate;
- The leach and adsorption circuits will consist of one pre-oxidation tank, three leach tanks and seven CIL tanks fitted with mechanical agitators, with cyanide being added to the second and subsequent tanks. The leach and adsorption circuit residence time will be 24 hours;
- CIL adsorption of gold and silver will be carried out in seven tanks, with “pumping screens” moving leached slurry between the tank units. The carbon will advance counter current to the main slurry flow during periodic transfers of slurry and carbon using carbon advance/transfer pumps from a downstream to upstream tank;
- The loaded carbon will be treated in an Anglo American Research Laboratory elution and electrowinning circuit consisting of an acid wash column and an elution column operating at 120° C. An electric heating system will provide the necessary temperature, and two additional heat exchangers will control the temperature around the circuit. A rotary kiln operating at 750° Celsius will be used to maintain carbon activity. Electrowinning will be carried out to recover gold and silver from the elution solution and the resulting metallic values will be dried and smelted to doré bullion;
- Cyanide destruction using an SO2 oxygen system will be carried out in the final tailings slurry, with the sulfur dioxide produced by the combustion of elemental sulfur.
A schematic showing the proposed flowsheet for Phase 1 is provided in Figure 5.
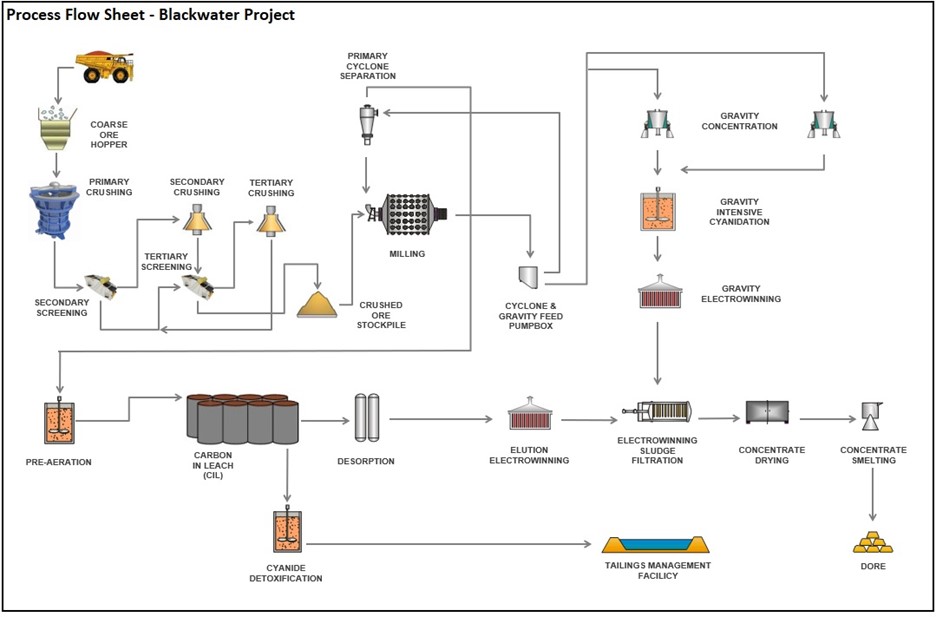
Figure 5 – Blackwater Phase 1 Process Flow Sheet
Phase 2 Expansion:
The Phase 2 expansion to 12Mtpa has been simplified to be achieved with only minor modifications needed to the existing phase 1 crushing, stockpile and ball mill feed system. The second ball mill will operate in series with the Phase 1 mill. The rest of the plant circuits will be duplicated (gravity concentration, leaching, adsorption, elution and cyanide destruction) or expanded. Minor upgrades will be carried out on some infrastructure to accommodate the increased throughput.
Phase 3 Expansion:
Phase 3 expansion to 20Mtpa will require a new process line, from primary crushing through to cyanide destruction, although a carbon elution circuit will not be needed as the Phase 1 and 2 units will have sufficient capacity with the lower ore grades in Phase 3.
Economic Results
Capital Cost Estimate
The Study outlines an initial capital cost estimate of C$645 million for Phase 1 (6Mtpa), expansion capital of C$347 million for the Phase 2 expansion to 12Mtpa, and expansion capital of C$374 million for the Phase 3 expansion to 20Mtpa. Sustaining capital over the LOM is estimated at C$831 million while closure costs are estimated at C$175 million (discounted to year 22)
Table 8 summarizes the initial capital cost estimate for the Project.
Table 8 – Blackwater Initial Capital Costs
Mining capital costs cover site development for the pits, haul roads and stockpiles, open pit mining to provide construction material to the project and expose ore for milling, mobile mining fleet costs and mine operations support infrastructure. The mobile mining fleet is planned to be purchased via various lease arrangements, with quoted commercial terms from the equipment suppliers. The leased mining fleet is paid off over several years, so costs are mostly captured as sustaining capital.
The biggest drivers associated with the estimated expansion capital costs are onsite infrastructure (C$43 million), modular expansion of the process plant (C$456 million), mining costs (C$63 million) and tailings management (C$137 million). Sustaining capital is estimated to average C$57 million per year for years 1-5, C$50 million per year in phase 2 and C$37 million per year in phase 3. Mobile fleet lease payments and mining support activities (C$430 million) and tailings management (C$271 million) are the primary drivers of sustaining capital costs.
Operating Costs
Operating costs by phase for the LOM are provided in Table 9.
Table 9 - Operating Cost Estimate
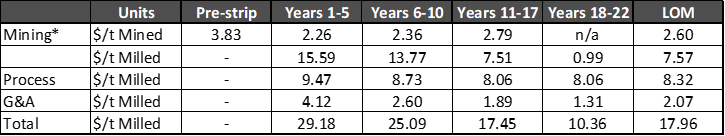
*Mining costs includes stockpile re-handle, LOM mining costs exclude pre-stripping
The operating cost estimates for the Project in Phase 1 is C$29.18/t, with economies of scale driving down costs to C$25.09/t milled in Phase 2, C$17.45/t milled in Phase 3 and C$10.36/t milled in Phase 4. Over the LOM, the Project has estimated average operating costs of C$17.96/t milled.
AISC
The Study outlines robust economics for the Blackwater Project during all four proposed stages with:
- Average annual production of 321,000 ounces of gold at an AISC of C$732/oz in Stage 1;
- increasing to 381,000 ounces of gold per year at an AISC of C$884/oz in stage 2;
- increasing to 438,000 ounces of gold per year at AISC of C$824/oz in stage 3; and
- reducing to 176,000 ounces of gold per year at an AISC of C$1,069/oz in stage 4, when mining operations cease and lower-grade stockpiles are processed.
In the calculation of AISC, the cost of mining low-grade ore in Phase 1, Phase 2 and Phase 3 of operations are included in AISC in the year that they are mined with a rehandling charge applied to the AISC when low-grade stockpiles are processed in Phase 4. The AISC in Phase 4 is also impacted by the inclusion of LOM closure. Over the LOM, the Study estimates an AISC of C$850/oz (or US$672/oz) on production of 7.45 million ounces of gold, which places the Project in the bottom quartile of the global cost curve for gold project (source: World Gold Council).
Selling Costs, Royalties and Taxes
Selling Costs
- Payable factor (Au) of 99.9%
- Payable factor (Ag) of 95.0%
- Refining, treatment, transport, and insurance charges of $3/oz applied to AuEq ounces.
Royalties
The Study economics consider two private royalties at 1.0% and 1.5% payable over portions of the Mineral Reserve, and these have been applied to the economic cash flow model using life-of-mine average royalty rates. Estimated payments to First Nations are also included in the economic cash flow model for the Project.
Taxes
Key provincial and federal tax considerations for Blackwater include:
- British Columbia mining tax: 2% provincial minimum tax payable on net current proceeds which is creditable against the 13% effective mining tax rate which is calculated based on operating profit less applicable capital cost deductions. The mining tax is deductible in computing provincial and federal income tax;
- British Columbia provincial income tax: 12.0%, payable after applicable deductions are made;
- Canadian federal income tax: 15.0%, payable after applicable deductions are made.
Levered Case Assumptions
In the economic results for the Project, the Company presents a base case economic analysis, being unlevered, plus an alternate levered case. The levered case is based on the following assumptions, which are supported by the credit approved term sheet executed with Macquarie Bank Limited and National Bank of Canada in April 2021 for a C$360 million project debt facility:
- C$360 million (plus up to C$25 million in capitalized interest) in project debt financing;
- Annual interest rate of Canadian Dollar Offered Rate (assumed at 0.5% in the Study) plus a margin of 4.25% up to the date of completion, with the margin reducing to 3.75% once the Project is effectively in commercial production;
- Customary upfront and standby financing fees;
- Six-year term post commencement of commercial production with Principal and capitalized interest repayable in quarterly installments over six years, commencing one year following achievement of commercial production, with a repayment holiday during years 4 and 5 of production while the company expects to undertake its Phase 2 expansion;
- Expansion capital is assumed to be funded through operating cashflow.
Next Steps
Over the next 12 to 24 months, the Company will be focused on the following activities:
- Completing an NI 43-101 Technical Report in respect of the Study, which will be filed on SEDAR and on the Company’s website within 45 days of this news release;
- Finalizing a C$360 million project loan facility;
- Progressing and achieving final permitting required to commence Project construction;
- Continuing engagement and negotiations with First Nations who may be impacted by the Project;
- Planning for an exploration core drilling program to test for potential extensions of the known mineralization;
- Finalizing fixed-price EPC contracts based on the GMP MOU awarded to Ausenco for the process plant and the GMP awarded to the consortium led by Carisbrooke Consulting Inc. for the power facilities for the Project;
- Commencement of Early Works activities onsite in H1 2022
- Commencement of Major Construction Activities in H1 2022
Qualified Persons
The Qualified Persons that will prepare the Technical Report on the Study include: Marc Schulte, P.Eng., (MMTS), George Dermer, P.Eng. (MMTS), Sue Bird, P.Eng. (MMTS), Daniel Fontaine, P.Eng. (KP), John A. Thomas, P. Eng. (JAT MetConsult Ltd.), Robin Kalanchey, P. Eng. (Ausenco), Philip Lee, RP. Bio. (ERM), James Garner, P. Eng. (Allnorth) and John Dockery, P. Geo. (Lorax). Each of the Qualified Persons has reviewed and approved the technical information contained in the Study and in this press release in their area of expertise and are independent of the Company.
Technical Disclosure
Data verification programs have included review of QA/QC data, re-sampling and sample analysis programs, and database verification. Validation checks were performed on data, and comprise checks on surveys, collar co-ordinates and assay data.
In the opinion of MMTS, sufficient verification checks were undertaken on the database to provide confidence that the database is virtually error free and appropriate to support Mineral Resource and Reserve estimation.
Conference Call Details
The Company is hosting a live Q&A conference call on September 13 at 10:00 a.m. Eastern time (7:00 a.m. Pacific time) with the Artemis executive team. Participants may join the call by dialing:
Participant Dial-in Numbers:
International Toll: +1 (604) 638-5340
Toll Free – Canada/USA: +1 (800) 319-4610
Please provide the company name (Artemis Gold Inc.) to the operator. A recorded playback of the call will be available shortly after the call’s completion for 30 days by dialing:
International Toll: +1 (604) 638-9010
Toll Free – Canada/USA: +1 (800) 319-6413
Enter the replay passcode: 7729, an MP3 recording will also be available on the Artemis website.
Updates will be provided in due course.
ARTEMIS GOLD INC.
On behalf of the Board of Directors
“Steven Dean”
Chairman and Chief Executive Officer
For further information:
Nick Campbell, VP Capital Markets, +1 (604) 558-1107.
Chris Batalha, CFO and Corporate Secretary, +1 (604) 558-1107.
Neither the TSX Venture Exchange nor its Regulation Services Provider (as that term is defined in the policies of the TSX Venture Exchange) accepts responsibility for the adequacy or accuracy of this release.
Cautionary Note Regarding Forward-Looking Information
This news release contains certain "forward looking statements" and certain "forward-looking information" as defined under applicable Canadian and U.S. securities laws (together, “forward-looking statements”). Forward-looking statements can generally be identified by the use of forward-looking terminology such as "may", "will", "expect", "intend", "estimate", "anticipate", "believe", "continue", "plans", "potential" or similar terminology. Forward-looking statements in this news release include, but are not limited to, statements and information related to the results of the FS, including the forecasted economics of the Blackwater Project, expected gold production (and the grade of such gold production) from the Blackwater Project and projected operating, all-in sustaining and capital costs associated with the Company’s planned operations at the Blackwater Project; the FS providing higher accuracy and reduced risk with respect to the Company’s plans and estimates with respect to the Blackwater Project, including with respect to costing accuracy and scheduling improvements; planned increases in throughput; the filing of a technical report reflecting the results of the FS by the Company; the estimated mine life of the Blackwater Project; estimates of mineral reserves and mineral resources, including the assumptions and estimates used to generate such mineral reserve and mineral resource estimates; the Project development and mining plans, including the planned reduced footprint of the FS Stage 1 facility, planned installation of a gyratory crusher, upgraded conveyor, additional ball mill, four additional leach tanks and a transmission line to supply power to the Blackwater Project, planned mining and operational methods and specifications and expected ore, waste and overburden to be mined, strip ratios and gold and silver recovery; gold price, silver price and exchange rate assumptions; sensitivity analysis in respect of the Blackwater Project; the potential for resource conversion, project extension and exploration to increase expected mine life and expand expected gold production; planned improvements to the environmental impact of the Blackwater Project; the projected construction and operating timelines for the Blackwater Project, including the Blackwater Project being fully permitted for a start of construction in 2022 and to enter gold operation in 2024; the Company’s closure and reclamation plans, including the costs associated therewith; plans regarding the drill, load and haul fleet; planned metallurgy and production processes; assumptions with respect to the levered case economics for the Blackwater Project; the finalization of a C$360 million project loan facility; engagement and negotiations with Indigenous Nations; completing supplemental geotechnical and hydrogeological site investigation work; progressing and achieving final permitting; commencement of drilling and exploration programs; finalizing fixed-price EPC contracts for the construction of the Project; the merits of the Project; the Company’s plans and objectives with respect to the Project and the timing related thereto, including with respect to permitting, construction, improved economics and financeability, and de-risking development risks; and other statements regarding future plans, expectations, guidance, projections, objectives, estimates and forecasts, as well as statements as to management's expectations with respect to such matters.
Forward-looking statements and information are not historical facts and are made as of the date of this news release. These forward-looking statements involve numerous risks and uncertainties and actual results may vary. Important factors that may cause actual results to vary include without limitation, risks related to the ability of the Company to accomplish its plans and objectives with respect to the FS and the Project within the expected timing or at all, including the ability of the Company to improve the economics and financeability and de-risk the Project; the timing and receipt of certain approvals and the risk that certain necessary approvals may never be received; changes in commodity and power prices; changes in interest and currency exchange rates; that the sensitivity analysis presented in the FS may not accurately predict the economic sensitivity of the Blackwater Project to changes in input and other prices; that the cost estimates presented in the FS may not be representatives of the actual development, construction, operational and closure costs associated with the Blackwater Project; risks inherent in exploration estimates and results; the timing and success of the development of the Blackwater Project is not guaranteed and the Company may not construct and operate the Blackwater Project on the timelines or in the manner presented in the FS, or at all; that the Company may be unable to conclude the C$360 million project loan facility and may be required to pursue other methods of financing the Blackwater Project, or may be unsuccessful in financing the Blackwater Project; inaccurate geological, mining, and metallurgical assumptions (including with respect to size, grade and recoverability estimates, estimates of mineral reserves and resources and mine life estimates); changes in development or mining plans due to changes in logistical, technical or other factors; unanticipated operational difficulties (including failure of plant, equipment or processes to operate in accordance with specifications, cost escalation, unavailability of materials, equipment and third party contractors, delays in the receipt of government approvals, industrial disturbances or other job action, and unanticipated events related to health, safety and environmental matters); that the Company may not be able to increase expected mine life or expected gold production through resource conversion, project extension and exploration; political risk; social unrest; changes in general economic conditions or conditions in the financial markets; and that the Company not file a technical report in respect of the FS on the timeline required by applicable law, or at all. In making the forward-looking statements in this news release, the Company has applied several material assumptions, including without limitation, the assumptions that: (1) the Company will be able to accomplish its plans and objectives with respect to the FS and the Project on the expected timeline; (2) market fundamentals will accord with the estimates and assumptions contained in the FS; (3) the receipt of any necessary approvals and consents in connection with the development of the Blackwater Project in a timely manner; (4) that the cost estimates presented in the FS are representative of the actual costs associated with the development, operation and closure of the Blackwater Project; (4) that the Company will be able to conclude the C$360 million project loan facility on the expected terms; (5) sustained commodity prices such that the Project remains economically viable; and (6) that the geology of the Blackwater Project accords with the expectations and projections presented in the FS and that the Company will be able to mine at the Blackwater Project in accordance with the specifications set out in the FS. The actual results or performance by the Company could differ materially from those expressed in, or implied by, any forward-looking statements relating to those matters. Accordingly, no assurances can be given that any of the events anticipated by the forward-looking statements will transpire or occur, or if any of them do so, what impact they will have on the PFS, results of operations or financial condition of the Company. Except as required by law, the Company is under no obligation, and expressly disclaim any obligation, to update, alter or otherwise revise any forward-looking statement, whether written or oral, that may be made from time to time, whether as a result of new information, future events or otherwise, except as may be required under applicable securities laws.
Non-IFRS Performance Measures
The Company has included certain non-IFRS measures in this news release. The company believes that these measures, in addition to conventional measures prepared in accordance with IFRS, provide investors an improved ability to evaluate the underlying performance of the Project. The non-IFRS measures are intended to provide additional information and should not be considered in isolation or as a substitute for measures of performance prepared in accordance with IFRS. These measures do not have any standardized meaning prescribed under IFRS and therefore may not be comparable with other issuers.
Cash Costs
Cash costs are a common financial performance measure in the gold mining industry but with no standard meaning under IFRS. Artemis considers and discloses cash costs on a sales basis. The Company believes that, in addition to conventional measures prepared in accordance with IFRS, such as sales, certain investors use this information to evaluate the Project’s performance and ability to generate operating earnings and cash flow from its mining operations. Management uses this metric as an important tool to monitor cost performance.
Cash costs in the Study include production costs such as mining, processing, refining and site administration, less gross revenue generated from silver sales, divided by gold ounces sold to arrive at cash costs per gold ounce sold. Costs include royalty payments, permitting costs, and payments that are expected to be made to Indigenous Nations. Other companies may calculate this measure differently.
All-in Sustaining Costs
The Company believes that AISC more fully defines the total costs associated with producing gold. The Company calculated AISC for the purpose of the Study as the sum of cash costs (as described above), reclamation and sustaining capital, all divided by the gold ounces sold to arrive at a per ounce figure. Other companies may calculate this measure differently as a result of differences in underlying principles and policies applied. Differences may also arise due to a different definition of sustaining versus growth capital.
Note that in respect of AISC metrics within the Study, as such economics are disclosed at the project level, corporate general and administrative expenses were not included in the AISC calculations.
Appendix A: Average Proposed Annual Mine Production for the Blackwater Project